Located in the heart of the Walloon capital, the University of Namur combines tradition and innovation to offer quality teaching and cutting-edge research. With a wide range of academic programs and a strong human dimension, the University of Namur prepares its students for a promising future.
Studying at the University of Namur


Spotlight
News

News
-
Faculty of Medicine
Marc Hennequart, researcher at UNamur, receives a Grant from the Fondation contre le cancer (Cancer Foundation)
Medicine
Health
News
-
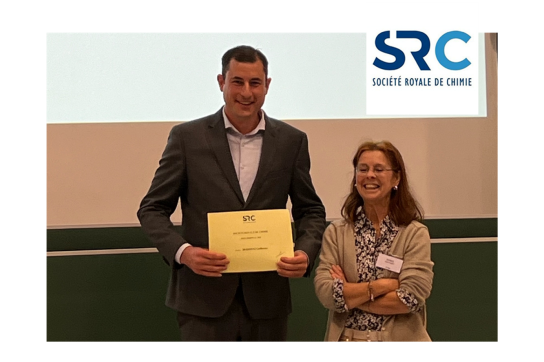
Faculty of Science
Guillaume Berionni receives the CRS Triennial Award
Price
Chemistry

Article
-
Faculty of Law
Fil Rouge de la Faculté de droit, a look back at a four-month period of activity
Law

Article
-
Faculty of Medicine
Skin infections: UNamur partners in Win²WAL research project
Medicine
Health
You are

7 faculties, at the heart of today's teaching and research.
Faculty of Computer Science
See contentFaculty of Law
See contentFaculty of Medicine
See contentFaculty of Philosophy and Letters
See contentFaculty of Science
See contentFaculty of Education and Training Sciences
See contentFaculty Economics Management Communication Politics (EMCP)
See content11 research institutes, places for the development of interdisciplinarity for the benefit of knowledge.
DeFiPP Development Finance & Public Policies
See contentESPHIN Espace philosophique de Namur
See contentIRDENa UNamur Institute for Research in Didactics and Education
See contentILEE Institute of Life-Earth-Environment
See contentNaDI Namur Digital Institute
See contentnaXys Namur Institute for Complex Systems
See contentNaLTT Namur Institute of Language, Text and Transmediality
See contentNISM Namur Institute of Structured Matter
See contentNarilis Namur Research Institute for Life Sciences
See contentPaTHs Patrimoines, transmissions, héritages
See contentTransitions
See contentThe University in figures
7300
Students
7
Faculties
11
Research institutes
1831
Year of creation
